

A dashboard for the board
The board meeting's questions, answered before it.
Orion builds the picture of execution from everyday work: plans, deliverables, cycles and what people write in their reports. No report pieced together by hand the night before.
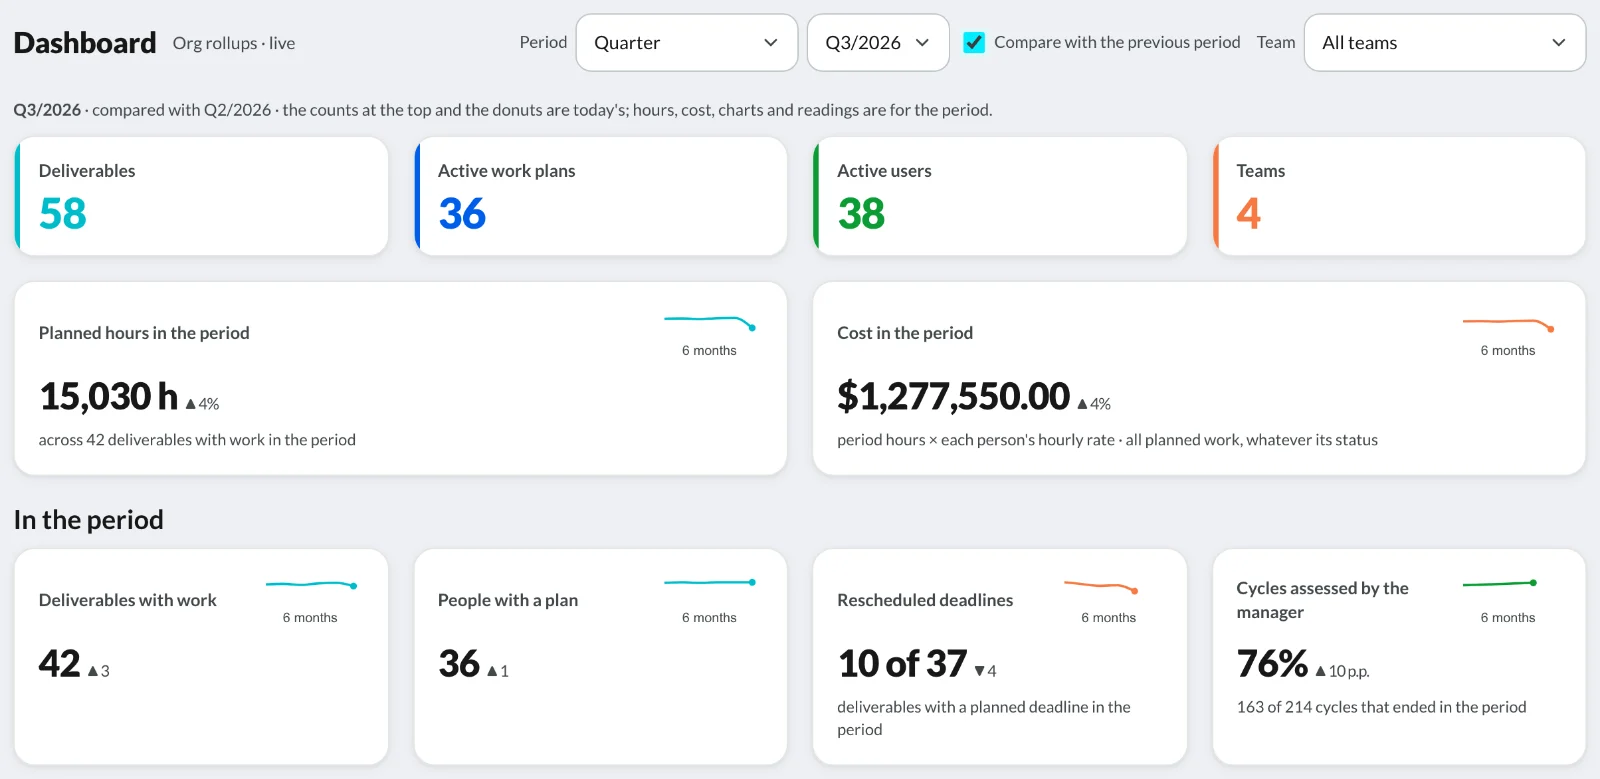
Money
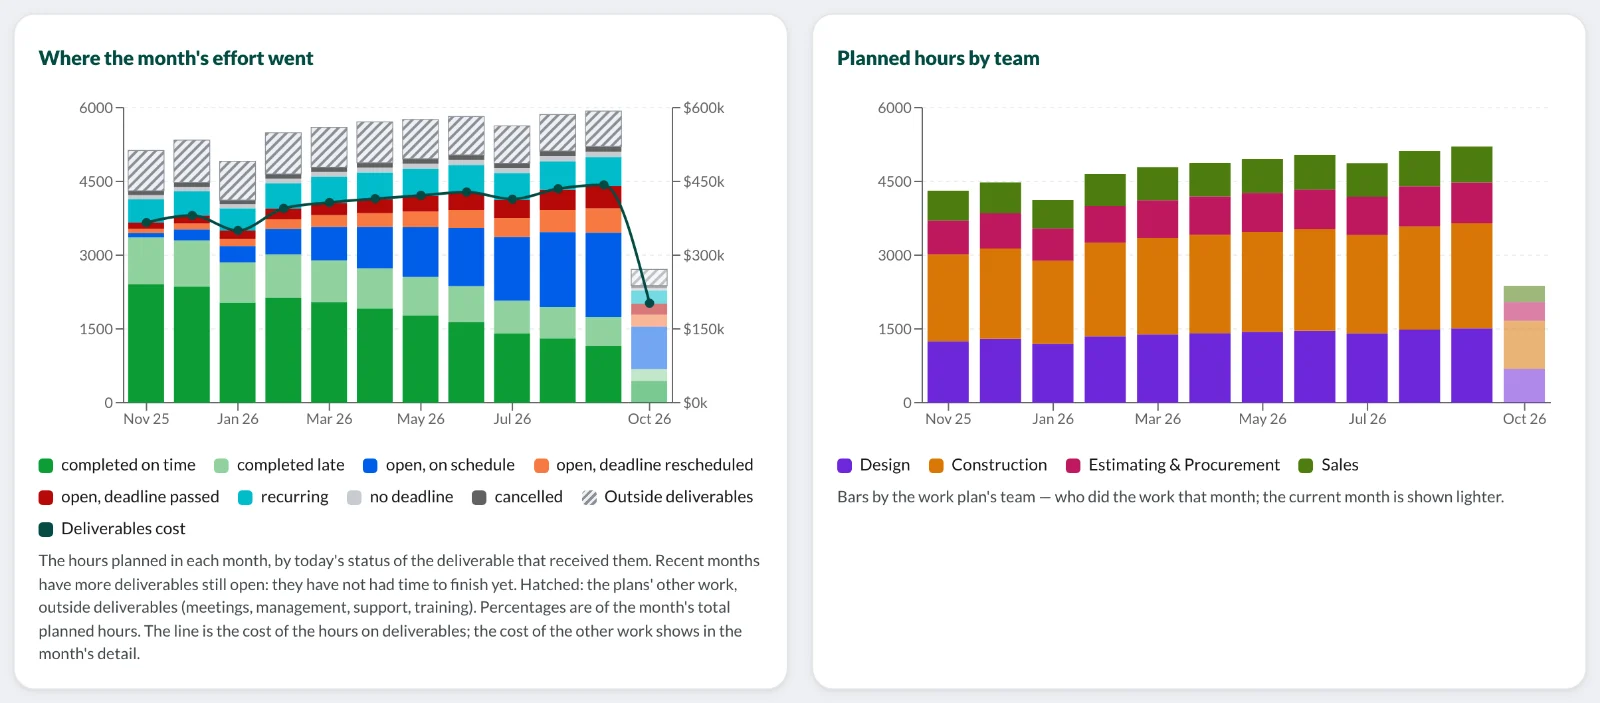
Where is the money going?
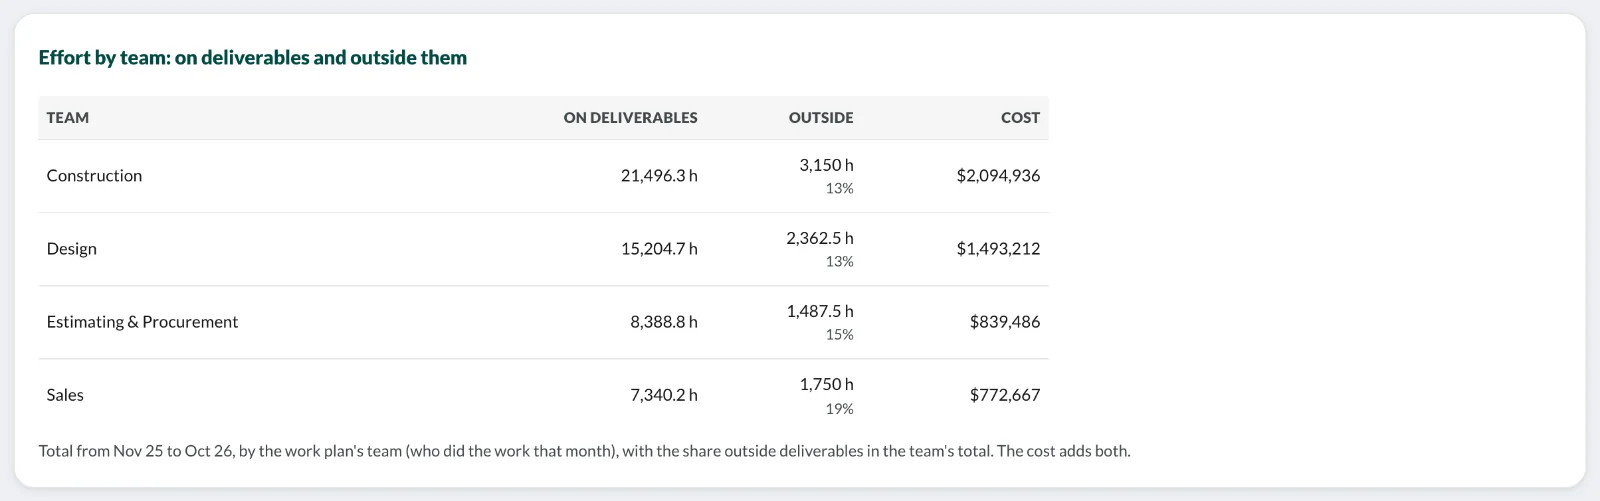
Each month's hours and cost by what each deliverable became: finished on time or late, open, overdue, cancelled. How much went to work outside deliverables, like meetings and support. And the cost of each team.
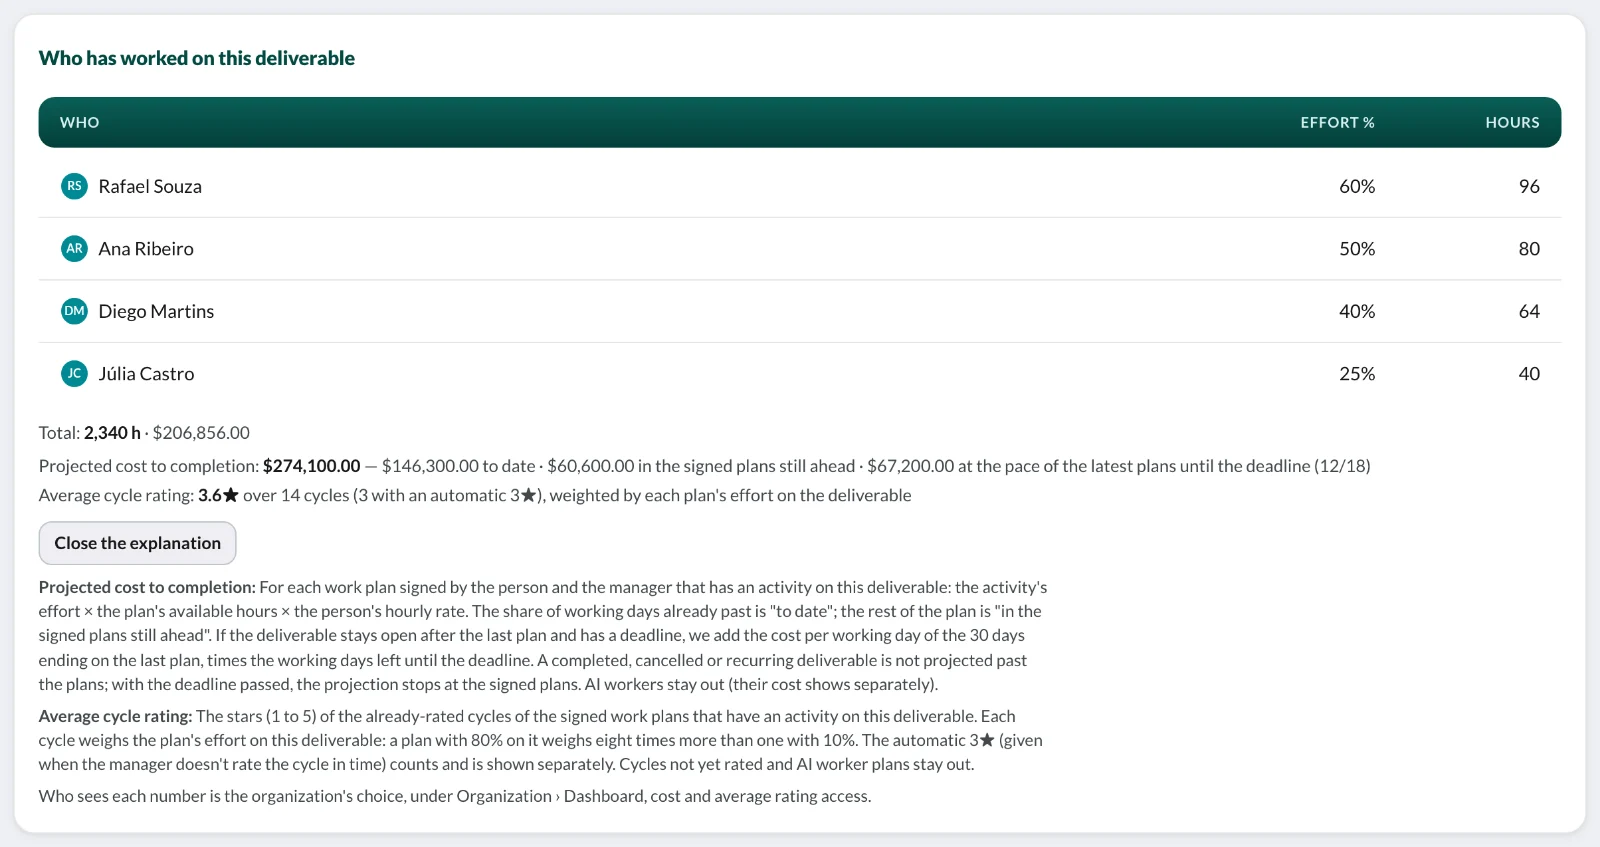
Deadline and cost to finish
Will we deliver what we promised? And at what cost?
The projected cost to completion of every deliverable, at the real pace of the latest plans. The deliverables at risk according to the people working on them, with the excerpt from the report that backs it up, before the delay shows up on the date. And what holds the teams back the most.
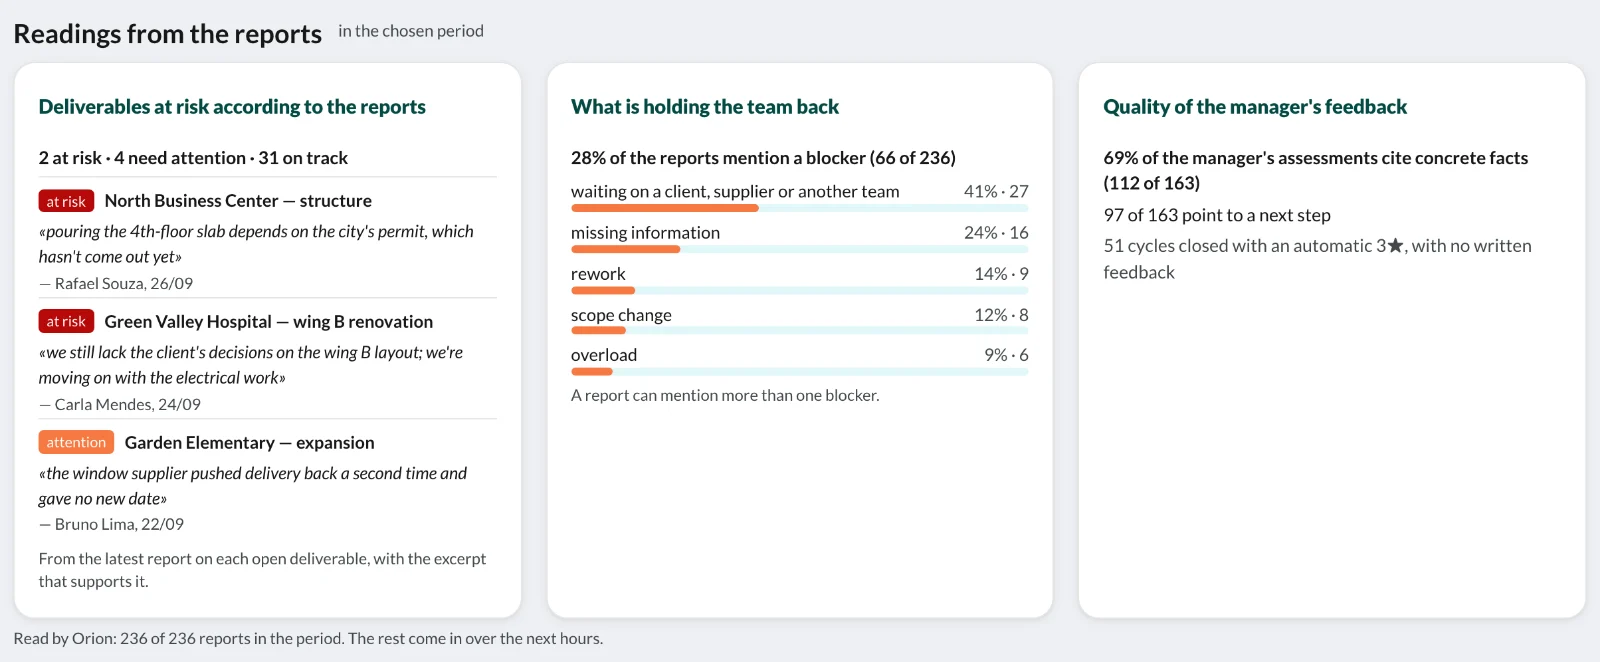
Management
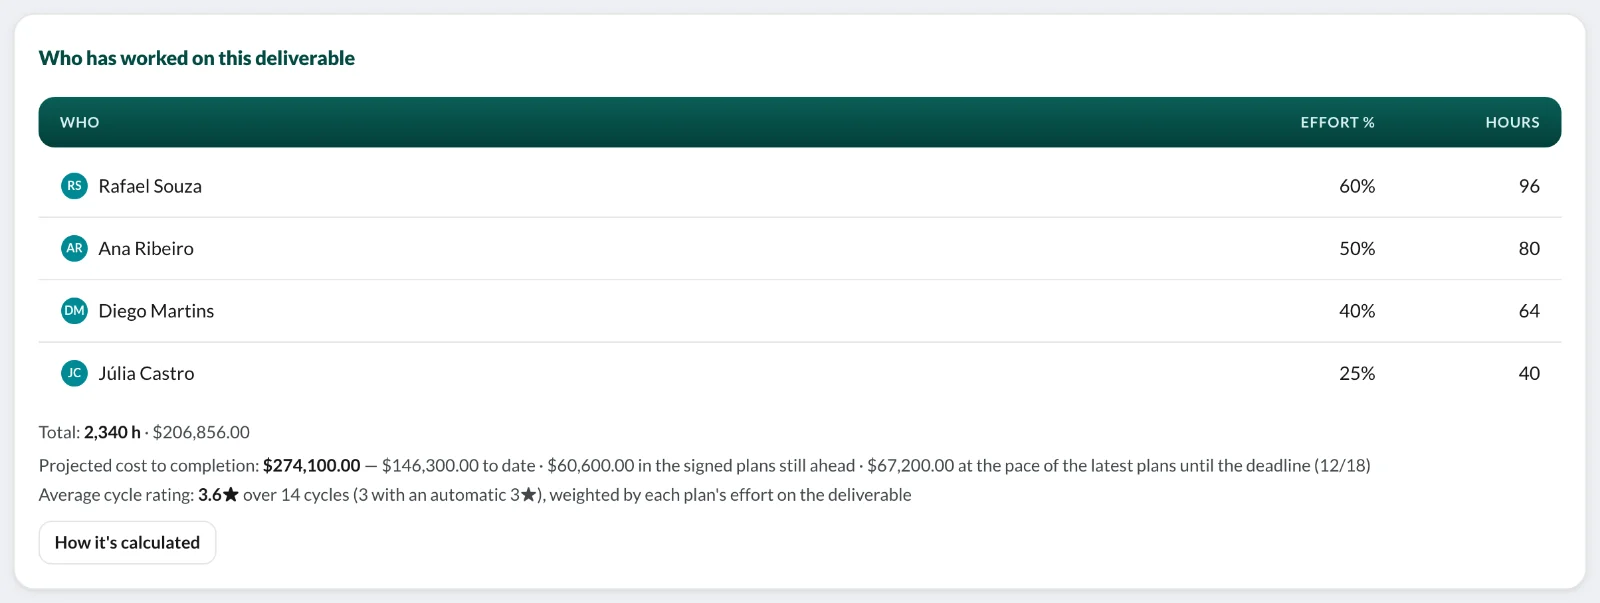
Is management really happening?
How many cycles the manager actually rated and how many closed automatically. Whether feedback cites facts and points to a next step. Rescheduled deadlines and the median delay. The average rating of each deliverable. All month by month and against the previous period.
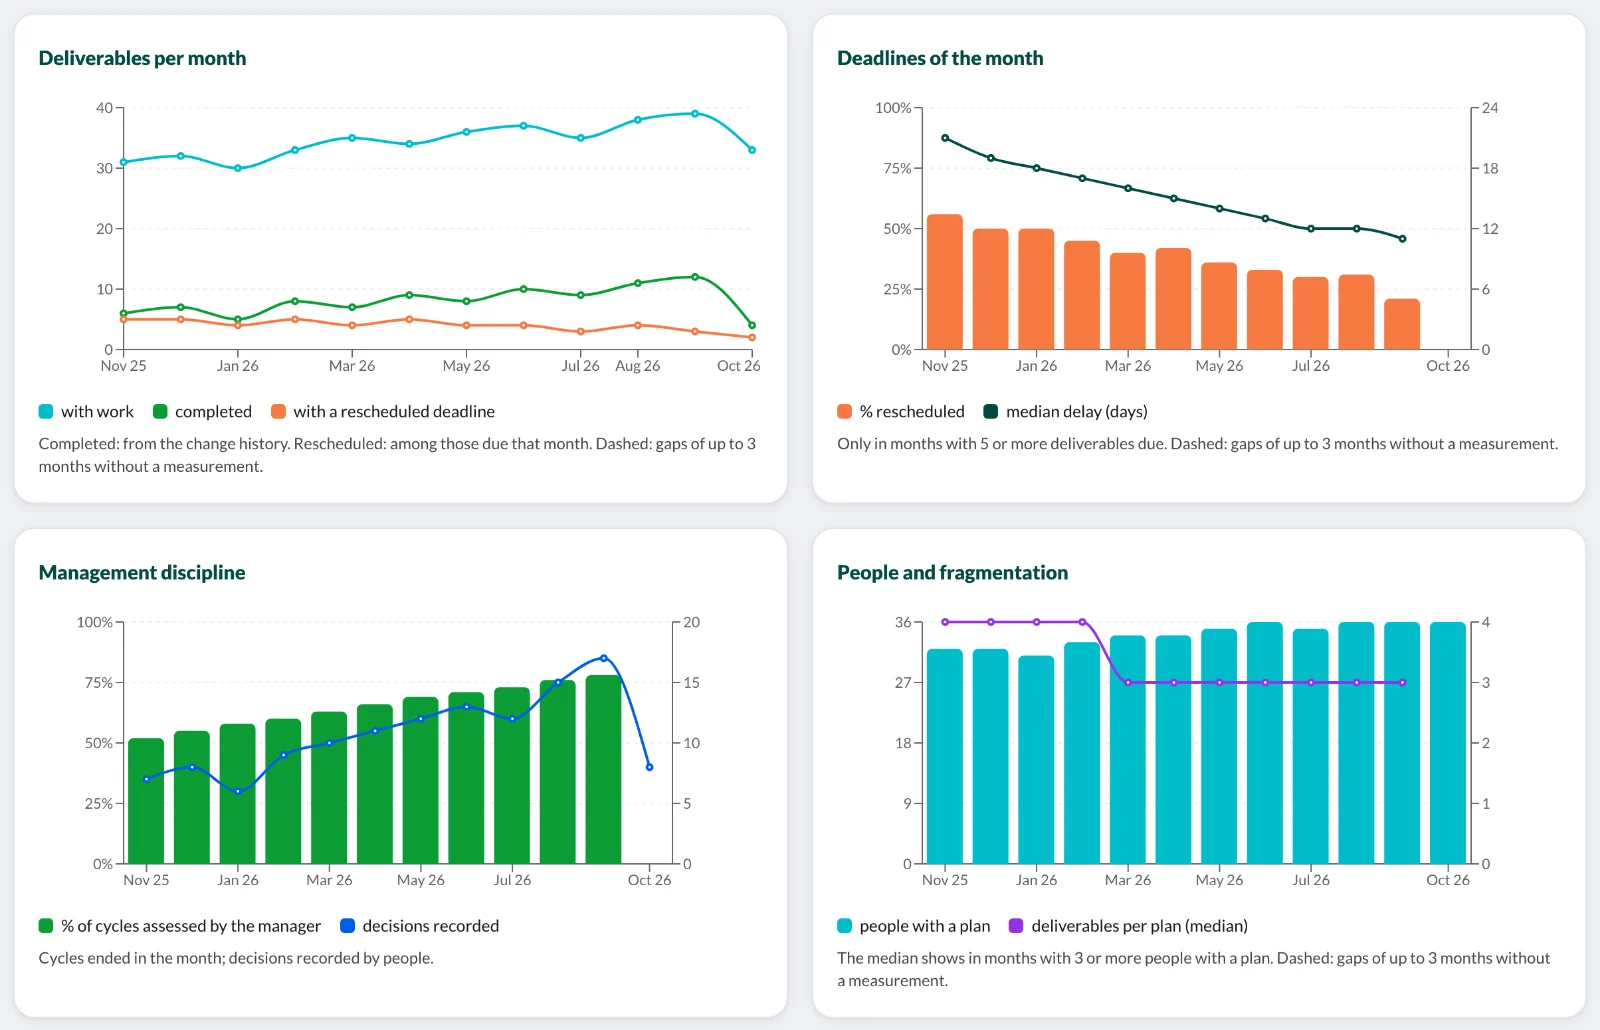
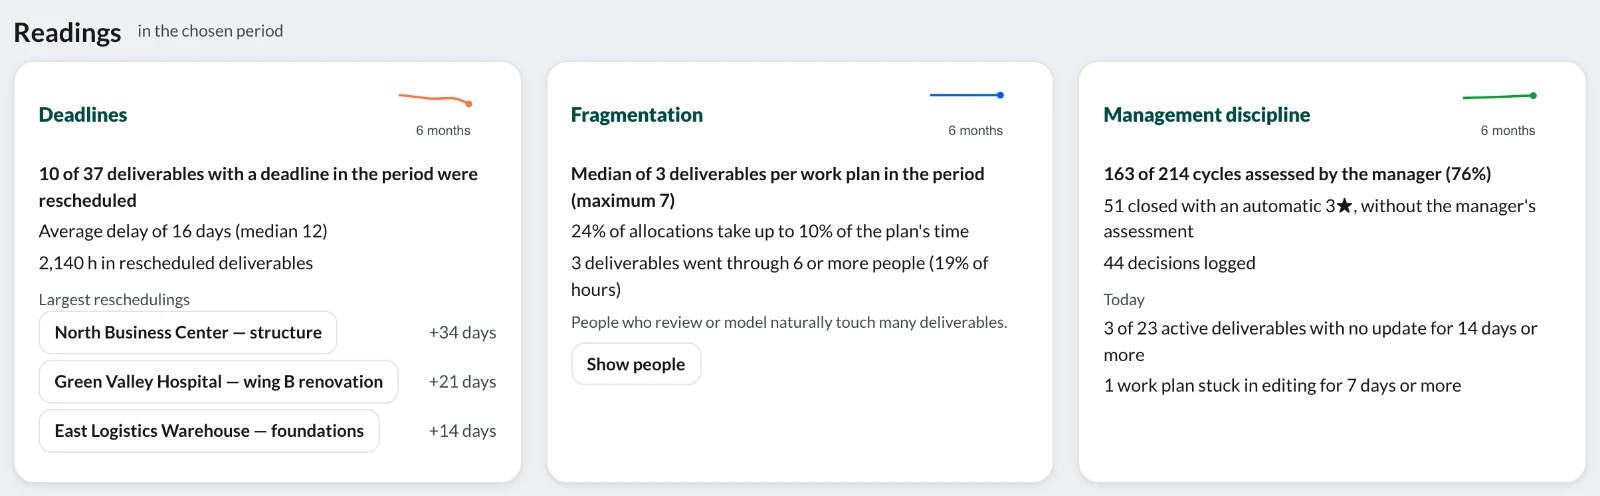
Why it's different
- It reads what people write.Typical dashboards add up what someone typed into a field. Orion reads the reports and the feedback and shows what they say, with the original excerpt.
- It ties effort to outcome.Every hour goes to what the deliverable became. And every deliverable shows what it will still cost to finish.
- It never makes numbers up.A month without data stays blank instead of turning into zero. A reading with too little data isn't shown. Every calculation shows how it was made.
Each company chooses who sees the dashboard, cost and ratings.
See the dashboard with your company's data.
In the 30-Day Challenge, Orion builds your company's dashboard from real work, together with you.
Every business, of one person or hundreds, with an AI manager at the center of its intelligence: it connects everything, keeps it at hand for whoever decides, anytime, anywhere, and makes what was decided happen.